CPU
21%System
7.0%
User
14.4%
Load avg
2.31
Temp
51°C
WindowServer48.0
Xcode34.6
Brave Browser Helper20.2
Top processes with one-click terminate. List length is yours, 3 to 10.
eulalia lives in the menu bar and shows CPU, GPU, memory, network, disks, battery and fans in real time, in the same glass it's built from. Free, open source, native SwiftUI.
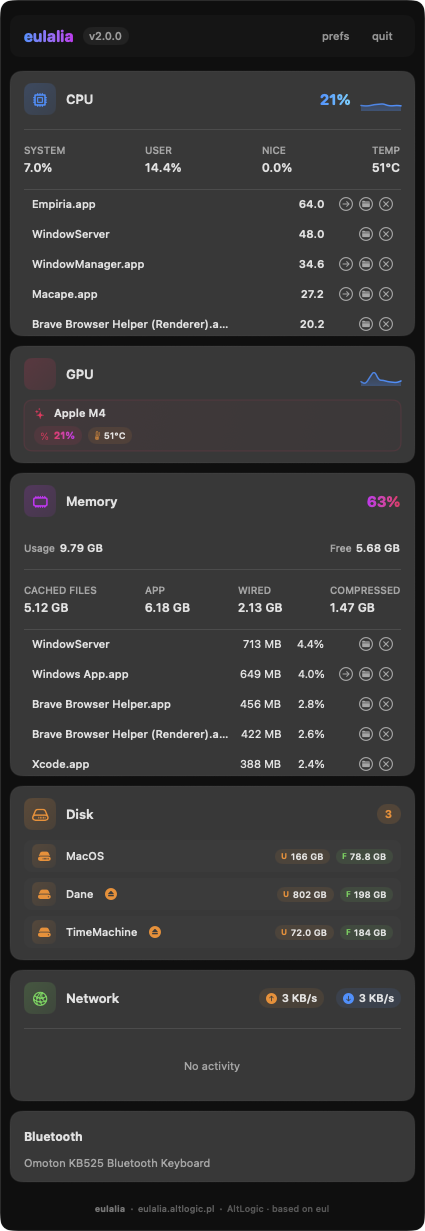
Each block below uses the app's real layout — same headers, same stat rows, same pills. Values shown are a sample reading; drag modules into your order and switch off the ones you don't need.
Top processes with one-click terminate. List length is yours, 3 to 10.
Pressure, history chart, and the apps eating the most of it.
Live speeds per interface, plus the processes generating the traffic.
Utilization and temperature, with Apple Silicon sensors included. No more N/A.
Free space per volume, one-click eject for externals.
Per-fan RPM on Intel Macs, straight from the SMC.
CPU, memory, network and battery widgets ship in the box — same data, Notification Center real estate.
Everything configurable, nothing scrollable: modules and their order, refresh rates, appearance, 20+ languages.
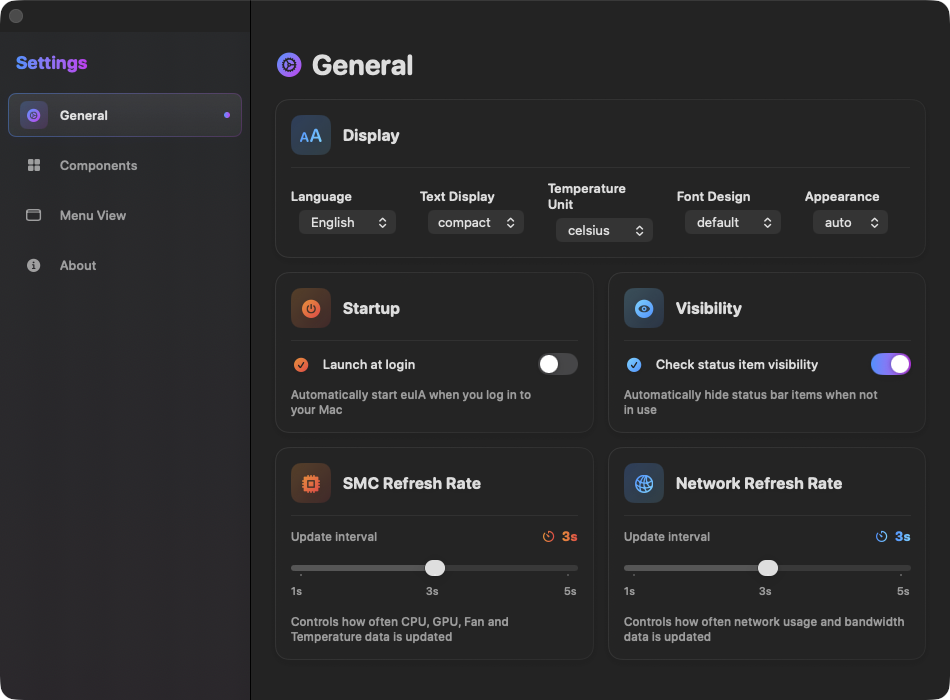
Grab the dmg below. Free, MIT-licensed, no account, no telemetry.
Open the dmg and drop eulalia into Applications. That's the whole install.
Pick your modules, set your refresh rate, and your Mac's pulse is a glance away.